What kinds of vocabulary are students going to be looking for in this section?
- Mean
- Median
- Mode
- Range
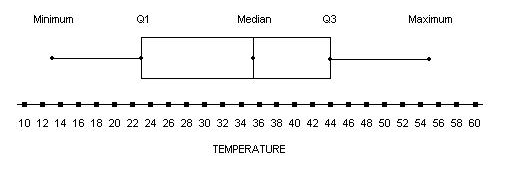
- Box plots
- Outliers
This lesson is important to start off with establishing and understanding these key terms, or students will be lost when trying to compute them or solve real-world problems with them. I found a great website that defines these terms and gives students context clues to familiarize them with the language:
http://www.icoachmath.com/math_dictionary/measures_of_central_tendency.html
Next, students need to know how to compute mean, median, mode, and range.
To compute mean, add all the data together and then divide by the number of data items.
To compute median, line up the values from least to greatest and strike out the numbers until the very middle is found. If the number of values is odd, the median is the middle number. If the number of values is even, add the numbers in the middle together and divide by two.
To compute mode, identify the value that appears most often.
To computer range, subtract the smallest value from the largest value.
Here’s a website where students can practice finding mean, median and mode: http://www.regentsprep.org/regents/math/algebra/AD2/Pmeasure.htm
An outlier is a value that is widely separated from the rest of the group. Most students are asked to identify outliers based on visual cues, but the mathematical definition of an outlier is any value that is more than 1.5 times the interquartile range.
The word interquartile is related to box plots, and the values that they represent. Box plots are visual representations of the five number summary, which is: median, Quartile 1, Quartile 3, Minimum, and Maximum.
This website shows the exact steps to finding these numbers, like we did in class: http://www.purplemath.com/modules/boxwhisk.htm